Background
Users want an easy way to browse the items based on their search terms to find what they’re looking for. We also wanted premium objects to be shown priority over free objects, to increase the conversion of paid items.
The first step was to understand how the users used the search function and to what end. We conducted a user survey with roughly 50 respondents and also conducted user interviews with eight of them.
Roughly 75% of users used the search function as a way to explore the range miniatures, while the remaining users wanted to find a particular miniature.
Identifying UX Issues
As UX Manager, I arranged a workshop with the UX Team, Data Team and Product Owner to identify possible UX issues based on our own Analytics data, best e-commerce practices and the aforementioned user surveys. The UX team later evaluated the results of the workshop and presented three priority issues.
Result Categories
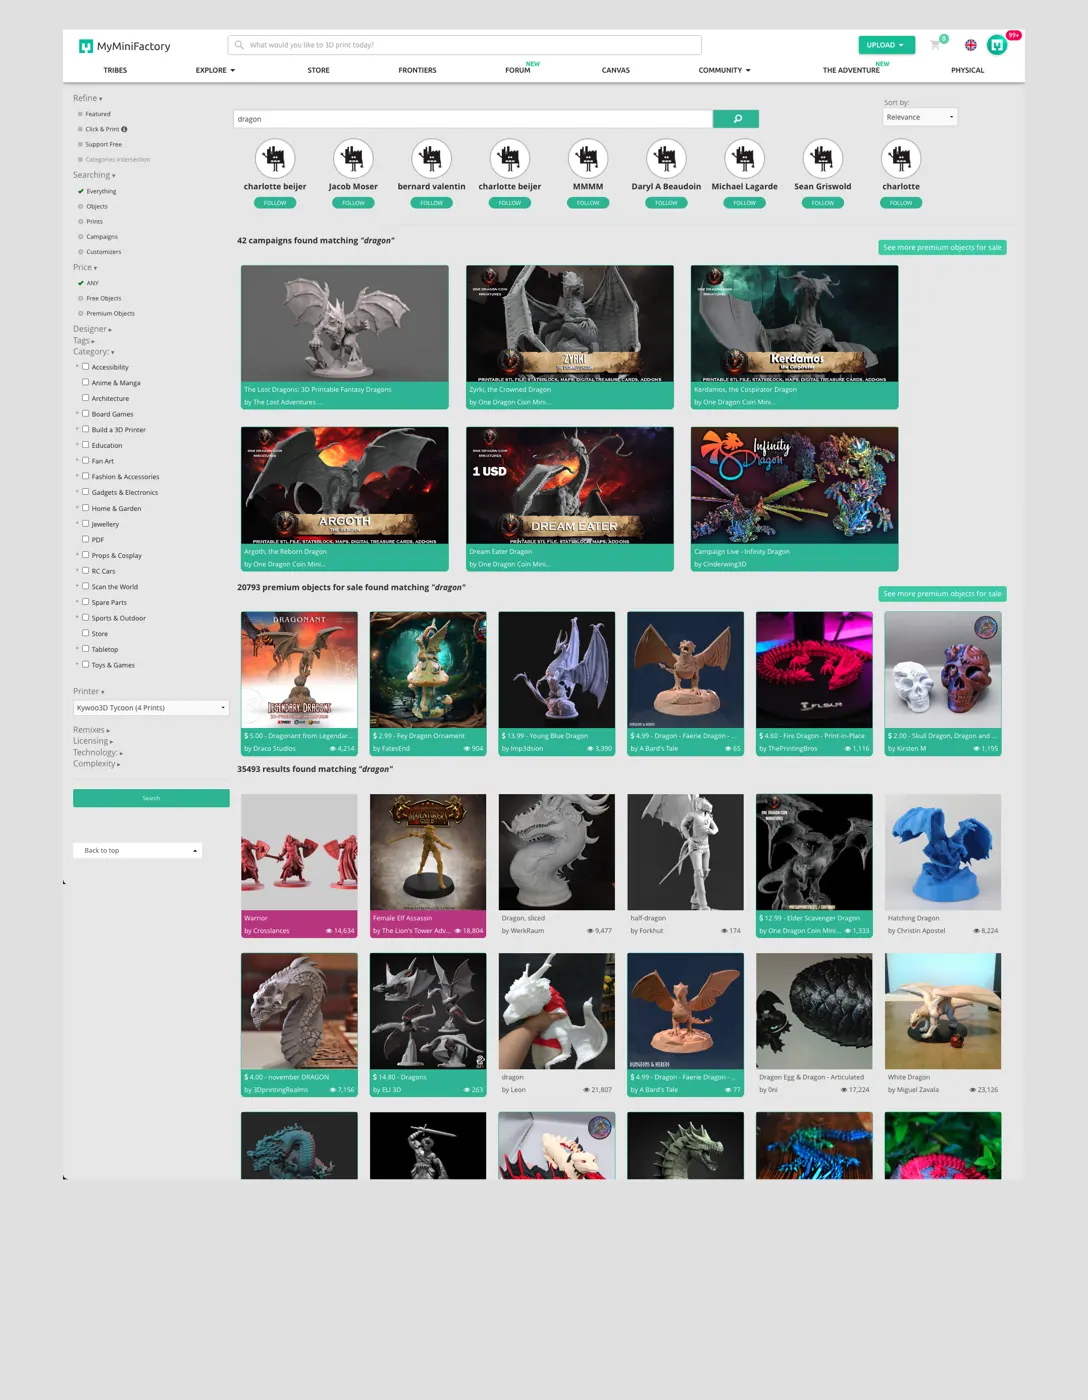
On the right, we've searched for the term “Dragon”, which is a very common term with over 35 000 results. The original search page displayed multiple results categories at once, all following different formats.
Explore the original search result structureFour categories with different formats and card layouts
Object Cards
The initial design was taken from Amazon, which uses wide rows with many different items. While this grid works well for Amazon, most e-commerce sites have opted for 3-4 items per row, with larger images, which has performed better in user testing according to Nielsen Norman Group, especially for products where visual design is important, such as fashion or indeed 3D models.
Sorting and filtering
The filter has high visibility on the left but suffers from option bloat. There’s too much to choose from with no discernable pattern of what options are helpful. The sorting drop-down is much better in this regard, but it’s not very visible, sitting to the right of the search bar, on the other side of the screen.
“It seems that the search results page is bloated with everything the user could possibly want, rather than focusing on the specific items the user is actually looking for.”
Design Solutions
The design had to fullfill the following criteria:
- Have a clear structure
- Results need to be easily scannable
- Present relevant but limited tools for sorting and filtering
We started by going back to the survey results and looked at user data for this page and the two presented a clear path forward: Users were interested in looking through premium items first and foremost, as those are perceived to be high quality items worthy of their consideration.
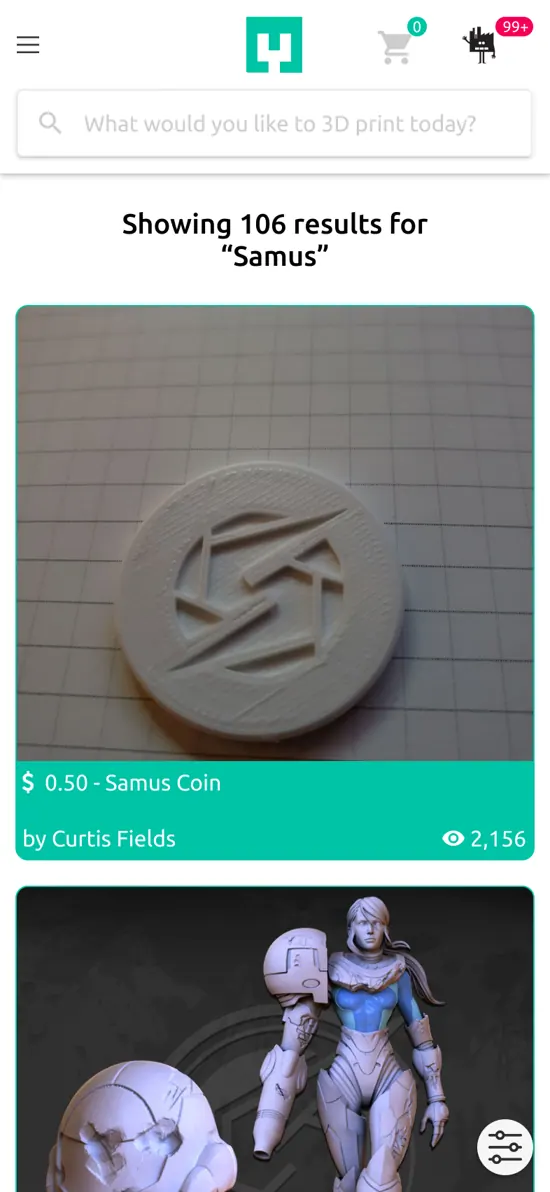
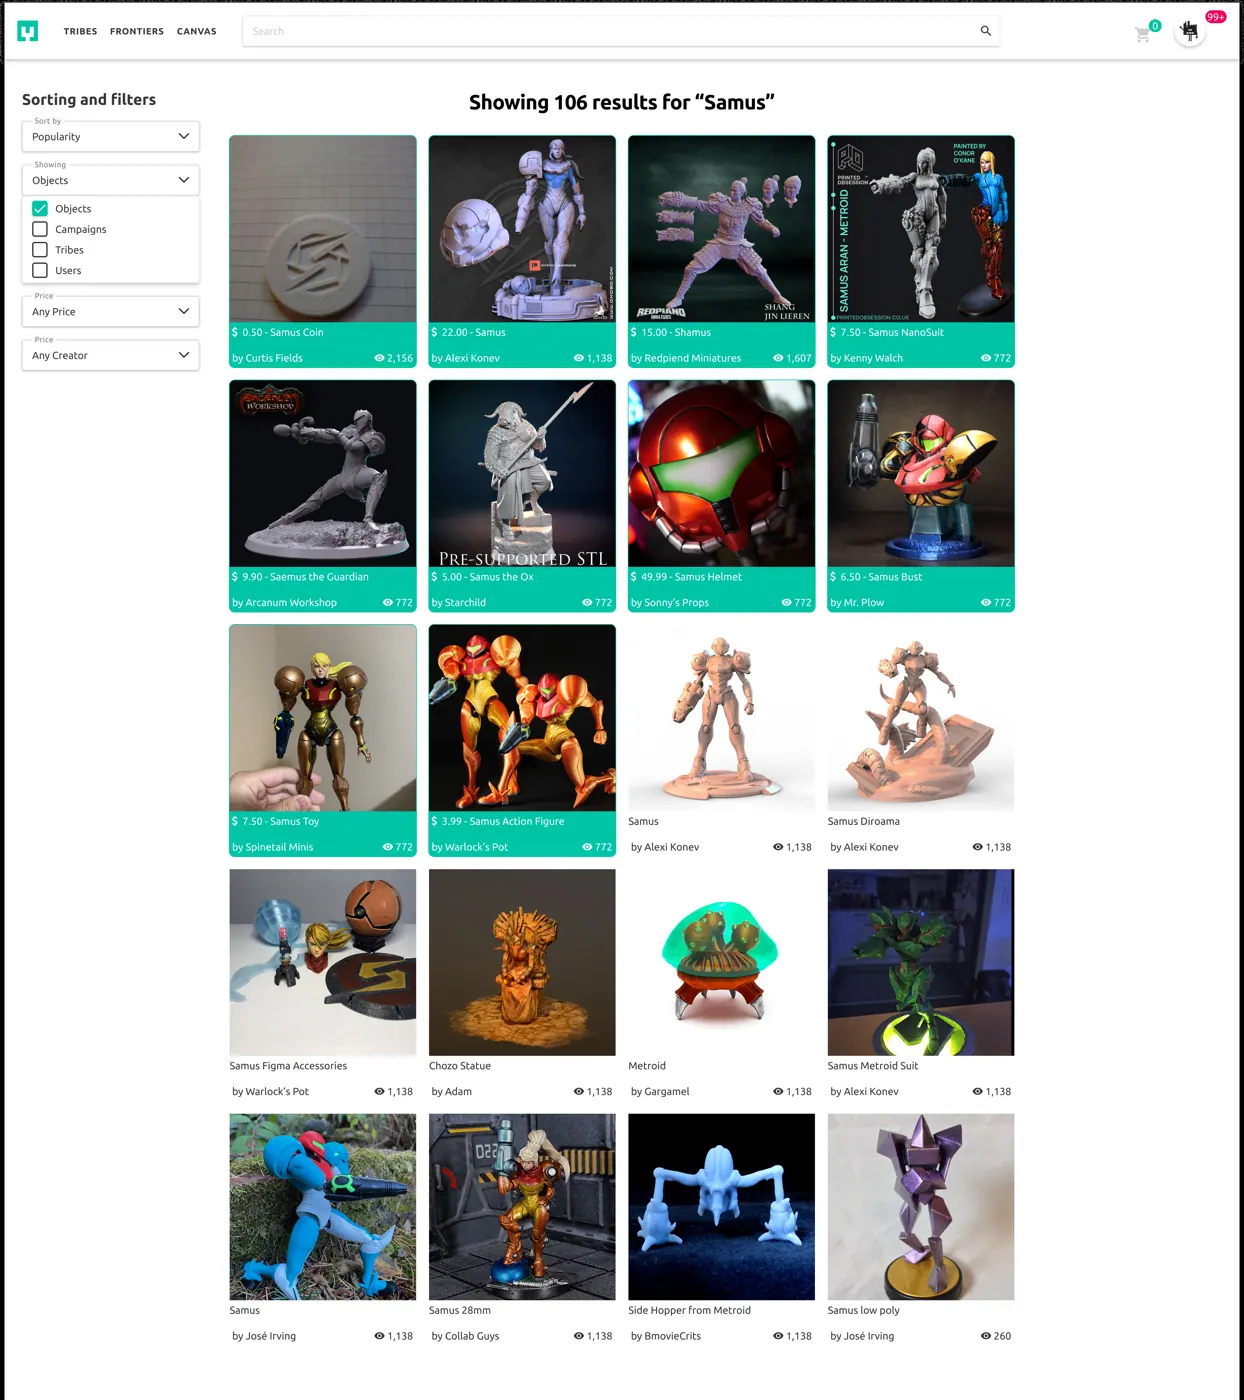
We chose to remove users and campaigns from the default results and only show a single grid of results, with Premium Objects being shown first. This grid was designed to use rows of 4, with larger images that allows users to more easily scan the page as they scroll. While we also identified opportunities to improve the object cards, it was deemed out of scope for this project.
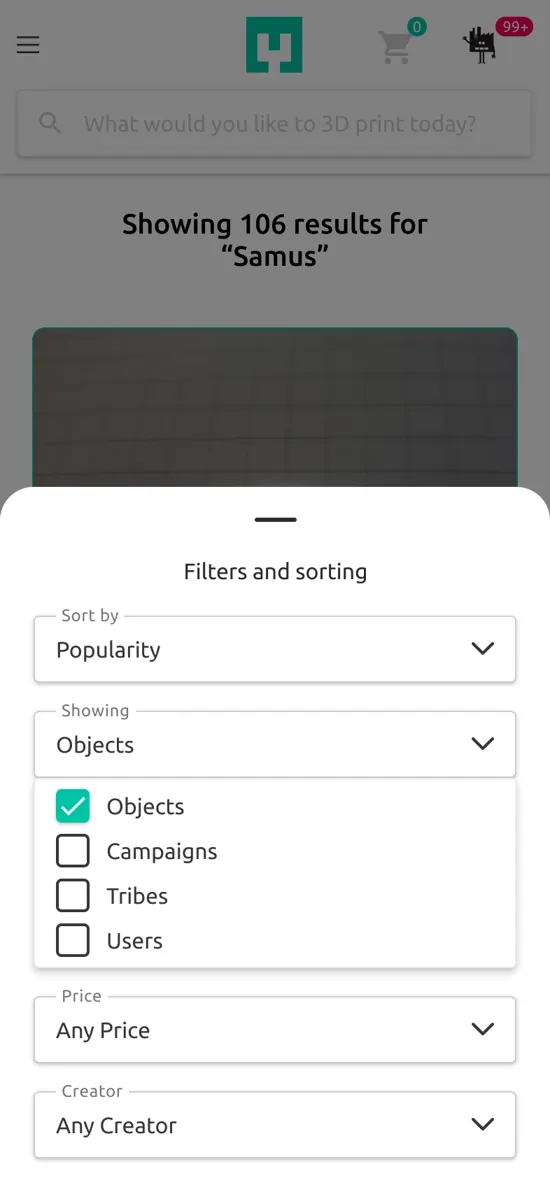
Lastly, Sort and Filter was completely redesigned with fewer but more relevant options. In the end, we went from a page that included every possible option by default, to one that was tailored to our users' needs, with easily accessible tools to refine results when needed.
Final Design
Results
Our A/B testing showed an 8% increase in purchases from search. We also found that users spent an additional half a minute on the search page on average. Initial follow-up data indicated that this was due to users finding more relevant items, as purchases were still made after longer durations.
During follow-up interviews, one contributing factor was prioriting premium items, which were often perceived as high value or high interest, meaning the users had to sift through less “junk”, as one user put it.
Overall, the design changes were well received by the site’s users.